


Your platform’s usability plays a key role in helping you generate traction and engage your target audience.
The easier it is for your visitors to navigate the required information, the greater will be the likelihood of you convincing them to consider the intended action.
The goal here is to offer a seamless experience to your visitors and enable them to seek answers to their questions effortlessly.
Click testing comes in handy, allowing you to assess the usability and performance of your platform.
It’s a user testing method that helps you identify the areas for improvement so you can make the necessary changes and improve your website’s functionality.
However, conducting a click test is an intricate process. It should be well-thought-out for you to access useful insights that can help you come up with a viable action plan.
This article showcases the essential metrics that you should consider for click testing.
So, without further ado, let’s get started.
What is Click Testing?
Before diving into the key click testing metrics, let’s cover the nitty-gritty of the process and understand it a bit better.
Click testing is an assessment method that helps you identify the issues with your platform’s performance.
Click tests are generally performed on website and app prototypes to enhance the platform’s usability and offer a better user experience.
The test helps you evaluate the effectiveness of your design process, navigation, and linking structure. It’s to ensure that the users are able to complete their intended tasks effortlessly.
To conduct a click test, you ask participants to complete a specific task by accessing your website. You monitor their action to see:
- Where they click first
- Which areas of your website receive the most clicks
- The sections that go unnoticed
Insights like these help you offer a seamless navigation experience to your visitors. You can fine-tune the user interface to align with the customer journey and minimize friction during the transition.
The following metrics will help you access useful insights when conducting a click test.
8 Essential Metrics to Consider for Click Testing
Now that we’ve talked about click testing, let’s explore the essential metrics that you should consider during the process.
Task Completion Rate
Task completion rate is one of the most important metrics that you should consider when conducting a click test.
When you perform a click test, you ask participants or users to complete a particular task or a series of tasks.
The task completion rate showcases the overall success rate of the users. It tells you about the percentage of users who could navigate the interface effectively and complete the assigned task.

If you ask the visitors of your website to add a particular item to the cart, the task completion rate would tell you the percentage of total visitors who actually did it.
Task Failure Rate
The task failure rate tells you the percentage of users who failed to complete the assigned task during the click test.
It helps you discover the percentage of visitors who were unable to add a particular item to the cart on your website.
Either they failed to locate a particular product or found the overall process to be daunting. It counts as a failed initiative if the users decide to abandon the task and choose not to do it. The task failure rate also increases when the task assigned is impossible to do in the first place.

For example, asking your visitors to add an unavailable product to the cart will lead you to acknowledge a 100% failure rate.
Partial or Indirect Completion Rate
Partial or indirect task completion rate represents the number of participants who completed the task, but their way of executing the task was different from what you expected.
For example, the visitors select a different path to find the item and add it to the cart compared to what you envisioned.
The way your participants choose to complete the task may be easier than you expected or more difficult.
Either way, tracking the indirect task completion rate will help you explore potential paths that your visitors may consider when navigating your platform.

You can use this information to optimize the experience you offer to your visitors and make relevant information readily available.
Screen Time
This indicator represents the time spent by participants viewing their respective screens when performing a particular task.
Generally, it’s favorable when a visitor spends more time on screen. It indicates high engagement and shows that visitors may like the content published.
However, a high screen time when conducting a click test may be alarming. It indicates that completing the task is likely more difficult for participants than expected.
Pairing these insights with errors during the test attempts will help you identify the problems with the user interface and come up with viable solutions.
Task Completion Time
Task completion time tells you how long an average user takes to complete the assigned task through your platform.
When conducting a click test, you should set an ideal time limit for completing a particular task. Then, you should track the time users spend to complete their respective tasks.
Suppose the task completion time of an average user is alarmingly high. In that case, it means that either you had unfair expectations when setting the time limit or the visitors found it difficult to navigate the required information.
There can be a number of factors that affect the user’s ability to complete the task within the set limit, such as the design process, information architecture, readability of the content published, and so on.
You need to find what causes the problems and come up with a plan to make the necessary improvements.
Holger Sindbaek, serial entrepreneur and the founder of the brain training platform Online Solitaire, says, “We noticed a significant drop in user engagement on Online Solitaire, particularly when players navigated through game options or made card selections. To get to the issue’s root, we conducted detailed click testing and discovered that the task completion time for these critical actions was longer than expected. The delays, even if only a few milliseconds, were enough to disrupt the user experience. By optimizing the interface based on our findings, we reduced task completion times, which led to a smoother gameplay experience and ultimately increased player retention by 18%. This process underscored the importance of closely monitoring task completion times during click testing to ensure seamless interaction.”
Errors During the Attempt
Website owners often try to stand out from other competing sites in their respective industries. In an attempt to create something different, they often go overboard and end up with an unintuitive user interface.
There’s nothing wrong with benchmarking the user experience and trying to be unique in the competitive landscape. However, it’s best to consider moderation.
Over the years, people have visited multiple websites and become acquainted with how they work. This exposure dictates their actions when they visit your platform.
A few changes won’t do much harm, but taking a completely different approach when creating your website may increase the chances of errors during task attempts.
You can assess these errors by keeping an eye on an average number of inaccurate clicks. These events occur when a user clicks outside the clickable areas to complete a particular task.

These clicks represent errors users make during task attempts because the user interface doesn’t align with the visitors’ expectations.
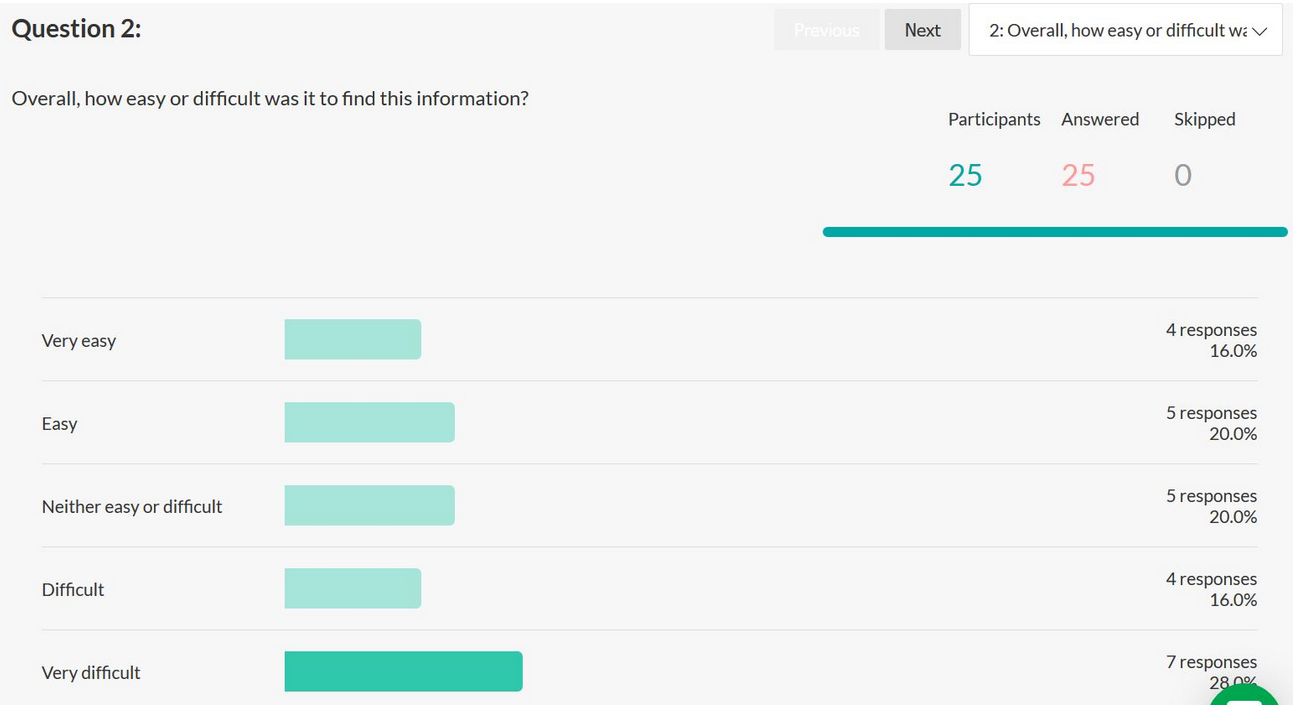
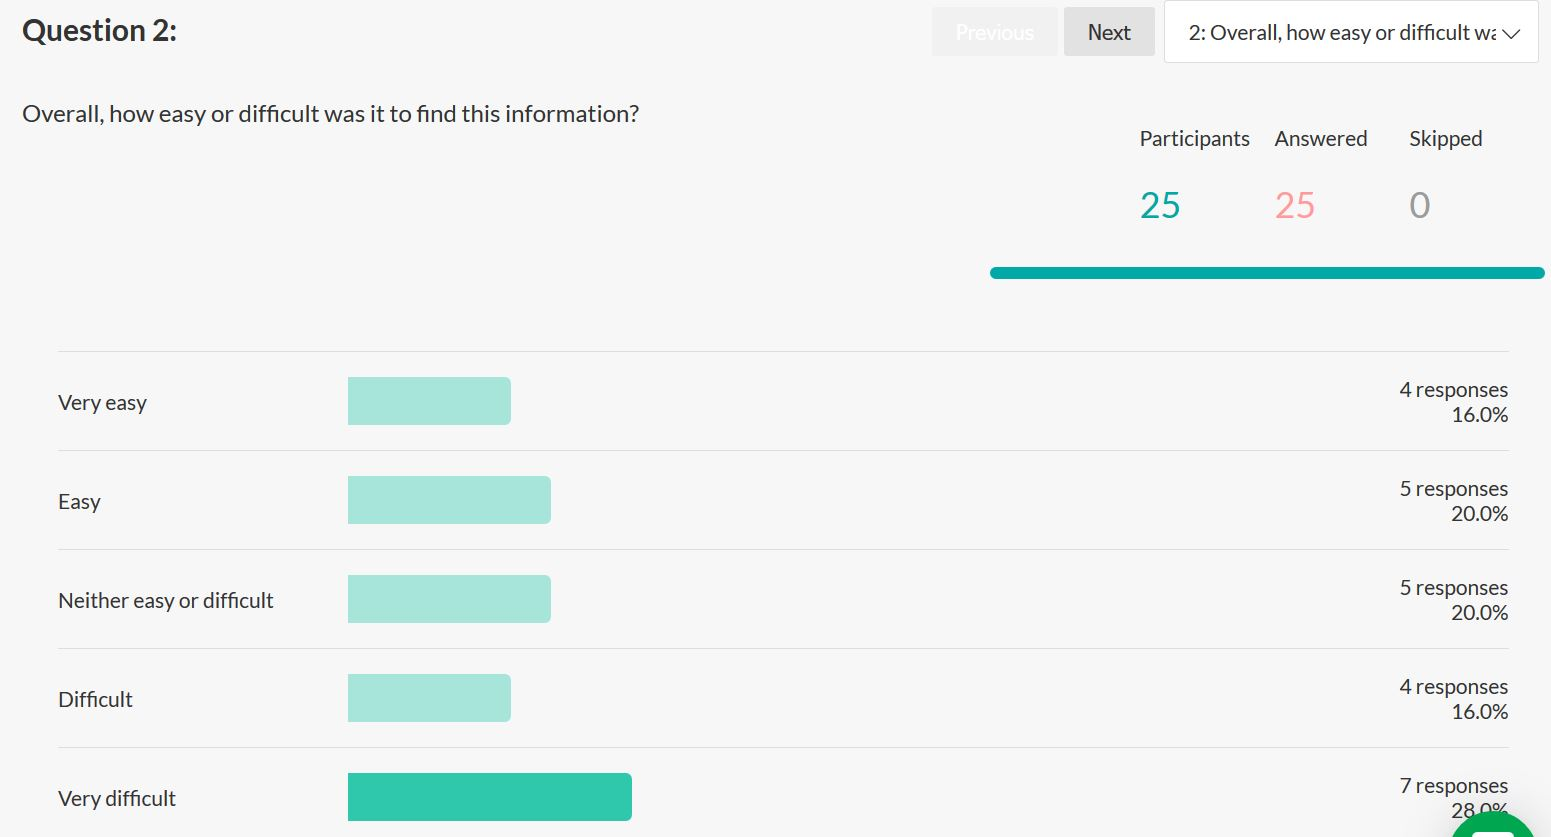
Task Difficulty
You can assess the difficulty level of the tasks based on the total number of errors participants made while attempting the tasks assigned.
A higher number of errors made while attempting the task indicates that completing the task is fairly difficult.
A task turns out to be difficult when you fail to provide clear instructions to complete it or due to poor usability of the platform.
The goal here is to improve the user experience and make it easier for the visitors to complete the intended actions.
Satisfaction Level
This metric showcases the participants’ experience when attempting the assigned tasks. You can consider assessing their satisfaction with respect to the following focus areas:
User Interface
To acknowledge a high satisfaction level representing participants attempting the task, you must design a user-friendly interface.
The goal here is to offer a glitch-free experience to your visitors and ensure that it’s easy for them to complete the assigned tasks.
Users’ hassle-free interaction with your platform helps you convey your message to the intended audience and cultivate high engagement.
Information Accessibility
Another indicator influencing participants’ satisfaction level when attempting the task is information accessibility.
If the information published on your website is easy to understand and effortless to access, the users will be able to complete the assigned tasks with ease.
It complements the overall task satisfaction level, as visitors will not struggle when performing certain actions on your platform.
Load Time
You may be surprised to know that a 1-second delay in the load time of your website may cause up to an 11% loss in page views and up to 7% drop in conversions.
The time your platform takes to load the requested information affects your ability to engage the intended audience.
So, it’s important to keep an eye on the satisfaction level of participants with respect to your site’s load time when conducting a click test.
It helps you identify problems early on and devise effective solutions, enabling you to improve the user experience you offer.
Mobile Friendliness
Around 59% of visitors from around the globe access their preferred websites through mobile devices.
So, it’s best to optimize your website to offer a seamless experience to its visitors by leveraging mobile testing.
Mobile testing enables you to see if it is easy for the participants to interact with your platform through mobile devices.
It helps you offer a seamless mobile or tablet user experience and allows you to cater to users’ diverse device preferences.
Final Thoughts
This article showcases essential metrics that you should consider when conducting a click test to improve the usability of your platform.
The indicators recommended will facilitate your access to relevant insights, enabling you to identify the problems beforehand and devise viable solutions.
As a result, you are able to offer a seamless experience to your visitors, which complements your website’s findability and online presence.When conducting a click test, it’s best to A/B test multiple variations of your platform and go with the one that gets the best scores.

- 7 Tips to Write User Experience Questions - March 17, 2025
- User Journey vs. User Flow: Differences and Their Importance for UX - February 4, 2025
- Graphic Design to UX Design: An Ultimate Guide to Transitioning - December 30, 2024
![]()
![]() Give feedback about this article
Give feedback about this article
Were sorry to hear about that, give us a chance to improve.