


In an online business, users’ experience on your website gives them the impression of whether they make or break with your business. Poorly designed interfaces and navigation can drive customers away, leaving competitors to reap the rewards.
UX allows you to assess your website’s performance against industry standards and competitors for a successful website strategy. With the five essential steps in benchmarking your website’s UX, you can enhance website findability and user satisfaction to position your website for success in the fierce competition.
What Is User Experience (UX) Benchmarking?
UX benchmarking aims to gather quantitative and qualitative data reflecting how users interact with the website or application, allowing businesses to identify improvement areas and continuously enhance website performance, user engagement and usability to optimize user satisfaction.
For instance, an e-commerce website implementing UX benchmarking conducts a usability test. It gathers feedback on its checkout process by comparing its metrics (task completion time and user satisfaction rating) with the standards and competitors. This helped them identify that users abandon their cart at some point, in which the business can make improvements, such as simplifying forms, to have a higher conversion rate and enhanced user experience.
Why Is It Important to Benchmark Your UX?
User Experience (UX) provides a systematic approach to business in evaluating the effectiveness of user journeys.
- Identify Gaps in Performance
Benchmarking can help pinpoint the areas where your website lacks in user expectations and industry standards and prioritize enhancements for a more enjoyable user experience.
- Enhance User Engagement
By understanding how users behave through user feedback and performance metrics, businesses can create more engaging content and features that foster high interaction and loyalty.
- Drive Data-Driven Decisions
With the gathered data, decisions about changes, feature implementation, and resource allocation are made with greater confidence and the likelihood of successful outcomes.
- Improve Conversion Rates
When businesses implement strategies to streamline the process, it encourages users to complete desired actions, such as purchasing or signing up for a newsletter, and improve conversion rates.
- Facilitate Continuous Improvement
Regular benchmarking means continuous improvement of the organization. This adaptation to changes that users need ensures that your website remains relevant and effective.
- Gain a Competitive Edge
Tracking your UX performance against competitors highlights your strengths, allowing you to differentiate your offerings and position your brand more favorably.
- Revenue Growth
A website that meets and exceeds users’ expectations enhances engagement, which increases conversion rates and revenue.
How UX Benchmarking Can Improve Your Website’s UX Performance
To improve your website’s UX performance, here are five steps you can take with UX benchmarking:
1. Determine Your UX Goals and Metrics
Start UX benchmarking by setting clear and measurable UX goals that align with your broader business objectives. For instance, if your website aims to increase online sales, you might include improving the conversion rate, increasing order value, and reducing the cart abandonment rate into your goals.
Select relevant metrics that help you assess the effectiveness of UX improvements and their impact on business outcomes, such as conversion rate, average order value and cart abandonment rate.
2. Perform an Analysis of the Selected Metrics

Collecting data on the chosen metric will then help you understand your current performance, which will serve as your reference point for future comparisons. Analytics tools can help you gather data over a specific period.
Analyze the data over time by identifying patterns and trends. You may use visualization through charts and graphs to highlight fluctuations that may not be visible in raw numbers. It also helps you identify recurring patterns, seasonal variations and anomalies in the data for a better understanding of user behavior and site performance. You may also segment your data based on demographics or behavior to identify trends within different groups.
For instance, you may look into spikes in user activity or drops in conversion rates in a certain campaign or website changes to pinpoint areas that need improvement and evaluate the effectiveness of past changes.
3. Analyze Competitor UX Performance
Identifying competitors is important for effective benchmarking. This will give you a comparative understanding of the market and help you achieve your goals.
Assess how your website’s performance stacks up against your competitors in certain areas and understand where your competitors excel to help you capitalize on your strengths and address weaknesses.
4. Implement User Testing and Feedback Loops
User testing, such as A/B testing and prototype testing, is vital in gathering qualitative and quantitative data. A/B testing can compare two versions of a webpage to see which performs better, while prototype testing can help evaluate a prototype with a real user to gather feedback before implementation.
This feedback helps identify actionable insights that can guide UX improvements to better align with user needs and preferences.
5. Monitor and Adjust Based on Findings
UX benchmarking is not a one-time activity, and it requires regular adjustments based on user feedback and performance data. Make sure that you continuously monitor UX metrics post-implementation through regular review and ongoing optimization to keep improving user experience and ensure it is meeting the desired goals.
Integrating the discussed UX benchmarking steps will keep you aligned with user needs and business objectives. Addressing users’ pain points in their journey can lead to higher conversion rates and sales.
With the data from UX benchmarking, you will be able to provide concrete UX and design process decisions without relying on assumptions, differentiating your website in the market.
UX Metrics You Need to Understand and Compare
UX metrics give qualitative and quantitative measurements of how users interact with your website, which is needed to evaluate and improve your website’s user experience.
User Engagement
Users interact with your website through clicks, scroll depth, and time spent on specific pages. High engagement means that users find your content relevant and useful, as they dedicate visits to your site and do meaningful interactions.
Bounce Rates
Bounce rates show the users who leave your site after viewing a page with no further interaction. A high bounce rate means that users did not find what they needed or the content is not compelling enough to encourage them for further exploration.
Session Duration

The average time a user spends on a site in a single visit is measured by session duration. Longer session durations indicate that users find your content engaging and opt to explore multiple pages.
Retention Metrics
Retention metrics examine repeat visits or the frequency at which users return, where you can assess their loyalty and ongoing interest. High retention rates indicate that your website is valuable for users to come back.
Conversion Rates
Conversion rates are crucial for e-commerce websites, where the goal is to drive sales, as they reflect the effectiveness of your website in turning visitors into customers. A higher conversion rate means a successful user experience that meets users’ needs and expectations.
User Feedback
Gathering user feedback about their experiences through surveys, interviews, or forms helps uncover pain points that quantitative metrics may not reveal, helping you understand the strengths and weaknesses of your website.
Page Load Speed

Page load speed is important for the user’s experience. 40% of users wait no longer than 3 seconds for a loading webpage, and if your site takes longer to load, they are likely to abandon your website out of frustration, increasing bounce rates. Make sure your page load speed is optimal.
Heatmaps and Click Tracking
Heatmaps and click tracking visualize where users click, how they navigate through your website, and which areas attract more attention. This will help you identify layout issues, content effectiveness, and potential barriers to seamless navigation that may be overlooked.
Tools for Effective UX Benchmarking
The appropriate tools you choose for UX benchmarking can help you track, compare, and measure key UX metrics effectively and lead you to make an informed decision for enhancing user experience. Here are some tools you can use for UX benchmarking:
Loop11
Loop11 enables organizations to gather insights into user behavior with remote user testing. It provides qualitative insights through real-time feedback, such as recorded sessions and surveys.
Loop11 offers video recordings of user sessions to observe interactions, customizable tests for specific user segments, and instant access to four diverse panels of testers. This tool is particularly useful for continuous feedback cycles, aiding in rapid prototyping and immediate design iterations.
Hotjar

Hotjar is an analytic and feedback tool for understanding user behavior at a granular level. It has heatmaps where users click, scroll, and move on the page, while session recordings allow you to watch real user interactions.
This tool’s feedback polls and surveys can also give input directly from users, providing a holistic view of the user experience. Its usability makes it ideal for teams looking to complement quantitative data with qualitative insights.
Google Analytics

Google Analytics allows businesses to understand user behavior quantitatively and track key performance indicators (KPIs). It offers comprehensive data on demographics and behavior and helps in tracking conversion to measure the effectiveness of campaigns.
Its ability to segment user data allows businesses to gain insights into specific demographics and behaviours. Google Analytics is recommended for its extensive features and integration capabilities, which are essential tools for continuous UX monitoring.
Case Study: Successful UX Benchmarking in Action
Baileigh Industrial, a top manufacturer of industrial metal and woodworking machinery, identified their major pain point through a sales-representative interview. It revealed that many customers are reaching out to sales representatives because they struggle to find the product or the product category they wanted on the website, wasting their time on the wrong path of the site’s navigation.

Upon measuring the navigation’s performance, it was found that information architecture could be improved, and sales calls about the major problem could be decreased. They narrowed the categories that customers would initially consider and provided product-category pages with the details of the various product options available.
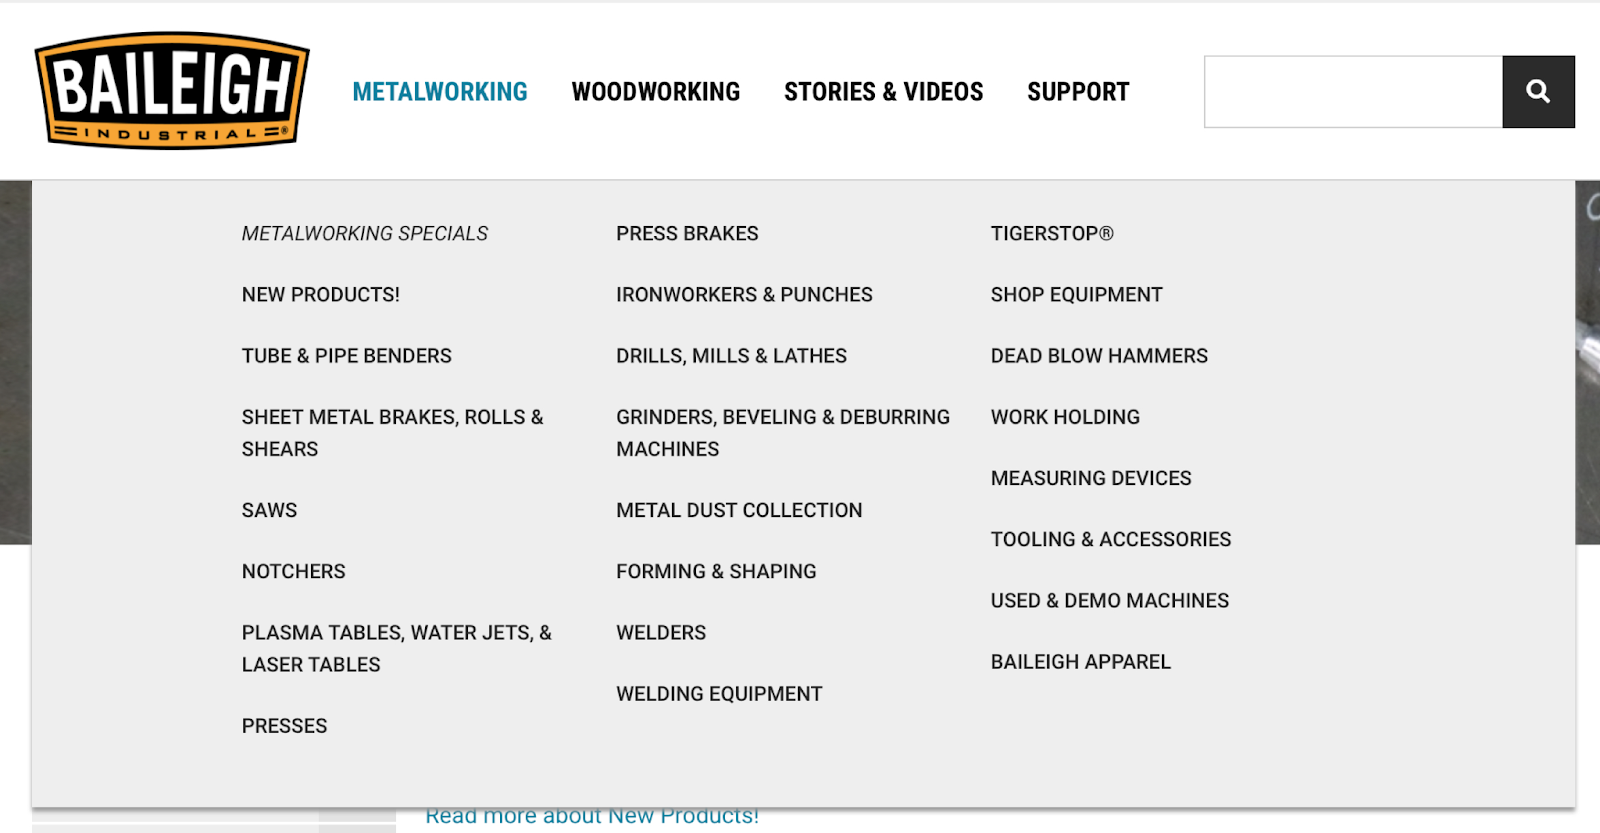
The overall result led to an 85% increase in product findability.
Summary
Effective UX benchmarking allows you to understand and improve user experience on your website. By closely monitoring key metrics with the help of analytics tools, businesses can gather qualitative and quantitative data that can help make informed decision-making and continuous improvement.
We encourage you to implement UX benchmarking to foster business growth and gain a competitive edge in the market.

- Benchmark Your Website’s UX in 5 Steps + Metrics to Measure - October 15, 2024
![]()
![]() Give feedback about this article
Give feedback about this article
Were sorry to hear about that, give us a chance to improve.